Evolving Beyond MAU: How Buffer Shifted to a Behaviour-Based North Star (Part 2 of 2)
- Simon Heaton
- Sep 23, 2025
- 8 min read

Updated: Dec 6, 2025

About this series
This is a two-part series on rethinking North Star metrics at Buffer. In Part 1 we unpack why Monthly Active Users (MAU) stopped serving us, and in Part 2 we share how we redefined our North Star around Weekly Active Users (WAU). Together, these posts explore how metrics shape strategy, retention, and long-term growth. I've written these with help from my colleague Julian Winternheimer, who was instrumental throughout this process.
This is Part 2 of a two-part series on shifting our North Star metric at Buffer.
In Part 1, we shared how our most important metric, Monthly Active Users (MAU), had started drifting away from the core value Buffer delivers. It was a useful proxy during early growth, but over time, it became bloated, tracking signals of activity without clarity on actual engagement or habit formation. MAU looked healthy, but publishing activity was slipping. Our North Star had quietly lost alignment.
This prompted a broader reassessment across the company. We realized that to build a product people returned to consistently, we needed to define “active” in a way that reflected real usage, not just surface-level interaction.
In this post, we’ll unpack how we went about redefining MAU, the challenges we faced along the way, and the shifts it unlocked across our teams, tools, and strategy.
Getting to a better question: What does “active” really mean?
Redefining a North Star metric isn’t a light decision. It requires rigour, alignment, and a shared understanding of the behaviour your product is meant to drive.
Once we acknowledged internally that our old MAU definition wasn’t serving us, the next step was deceptively simple: confirm our hypothesis was correct and find out what should count as active.
That kicked off a deeper exploration across product, data, and marketing teams. We weren’t looking for a more impressive number. We were looking for a metric that reliably signalled long-term retention and reflected habit formation around our core value.
This led us to a set of foundational questions:
What behaviour is most predictive of both short-term and long-term retention?
Which actions reflect Buffer’s core utility when all else is stripped away?
At what point in the journey does a user experience real value?
What patterns signal habitual product usage?
To answer these, we ran a series of cohort-based retention analyses. We compared 30-, 60-, and 90-day retention rates across users who completed each of the individual “key actions” that made up our composite MAU, as well as a few that weren’t included. Each action was isolated to control for overlap (e.g. publishing only vs. viewing analytics only), allowing us to see the unique correlation between early behaviour and longer-term retention.
We also segmented these cohorts by signup date and plan type (free vs. paid) to control for broader usage patterns. Our goal was to identify not just the most common actions, but the ones that consistently predicted stickiness.

The results felt intuitive, but the data made it undeniable: Publishing was the only action that consistently mattered.
Other behaviours, like viewing analytics, replying to comments, or creating drafts, were valuable, but they were layered on top of Buffer’s primary loop: create, schedule, publish. Without publishing, the rest didn’t hold up.
Specifically:
Users who published at least one post in their first 7 days were 2.3x more likely to be retained at day 30 compared to those who didn’t.
The shape of the retention curve for publishers was markedly different. Drop-off was slower, plateaus were higher, and reactivation rates were stronger across nearly every segment.
Among users who didn’t publish at all in their first 30 days, less than 10% were active by day 60… even if they completed other actions like viewing analytics or adding content ideas.
We also looked at cumulative publishing volume and frequency. There was a clear trend: the earlier and more often someone published, the more likely they were to retain. That helped us begin modelling not just a definition of activity, but a potential habit threshold (this is something we’ll share more on in the next section).

The insight was clear: if we wanted to build a product that formed habits, we needed a metric that reflected the habit itself. That meant anchoring our definition of “active” in publishing over generalized product activity.
From MAU to WAU: Shifting time horizons
Once we had clarity on what to measure, the next question became when. Specifically: what time horizon best reflects the natural usage frequency in our product?
Time horizons we select in metrics shouldn’t just be arbitrary windows, they shape how we interpret behaviour and define success. By measuring user activity from key moments, like signup or first activation, you can begin to understand the natural frequency of your product: how often users return to solve their core problem or experience your core value.
This matters because you want most retention, activation, and lifecycle strategies to be built around the natural usage frequency of your product. If those milestones don’t align with how users actually behave, you risk creating misaligned metrics and mistimed interventions.
We chose a 7-day window after analyzing natural usage patterns across our active user base. Most users scheduled content in batches, often returning on the same days each week to queue up their next round of posts. That weekly cadence wasn’t just common, it was consistent across various segments and plans.

A weekly model gave us the right level of granularity to detect meaningful behaviour change, without being too noisy or reactive. It also mapped closely to how our product was being used in the real world.
With that, our new North Star became Weekly Active Users (WAU), defined intentionally and narrowly as:
Users who sent at least one post in a 7-day window
Internally, we began referring to this as WAU.
This was a meaningful shift from where we started:
Old MAU: any key action in a 30-day period (viewing analytics, opening the app, creating a draft, etc.)
New WAU: a post sent through Buffer in the last 7 days

Segmenting WAU: Casual, Core, and Power Users
Once we had a tighter definition of Weekly Active Users (WAU), we realized there was still a meaningful gap: it treated all active users the same. But the behavioural differences between someone who posts once on a single channel and someone who posts 40 times across five channels are vast.
To reflect this range of engagement, we introduced WAU segmentation based on publishing frequency. This gave us a more nuanced understanding of user habits and more levers to improve retention and value delivery.
We landed on three core cohorts:
Casual Users: Fewer than 5 posts in the last 7 days
Core Users: 5 to 29 posts in the last 7 days
Power Users: 30+ posts across 2 or more connected channels in the last 7 days
These thresholds weren’t arbitrary. They emerged from Julian’s analysis of our usage distribution, and by segmenting WAU further through this lens, allowed us to:
Identify unique usage patterns based on different cohorts
Tailor onboarding and lifecycle messaging based on usage level
Identify which users were most likely to churn vs. retain
For a product like Buffer, natural usage frequency varies across cohorts. Some users publish content daily, while others do so weekly or even less often. The natural inclination might be to design experiences that move users from casual to core. But the reality is, many users can achieve meaningful outcomes even at lower frequencies.
Instead of nudging everyone toward higher usage, we’ve focused on supporting each cohort to succeed on their own terms. Publishing frequency became a behavioural lens that let us shift from counting active users to understanding how active, and what that meant for long-term value.
Modelling the Full Lifecycle: Weekly State Transitions
Redefining our North Star metric pushed us to rethink more than just what we measured. It also changed how we measured.
With Weekly Active Users (WAU) as our foundation and clarity of usage patterns, we also needed to modernize the way we track user engagement across time. Rather than simply measuring who was “active” in a given period, we wanted to understand how users moved through different stages of engagement: from first use to habit to ongoing retention, and from dormancy to reactivation.
To do that, we developed a new engagement and lifecycle model built on our defined publishing behaviour and tracked on a weekly cadence. This model was inspired by the work of the Duolingo Data Team, who generously offered a clear view into the engagement movements of a Duo user in this article.
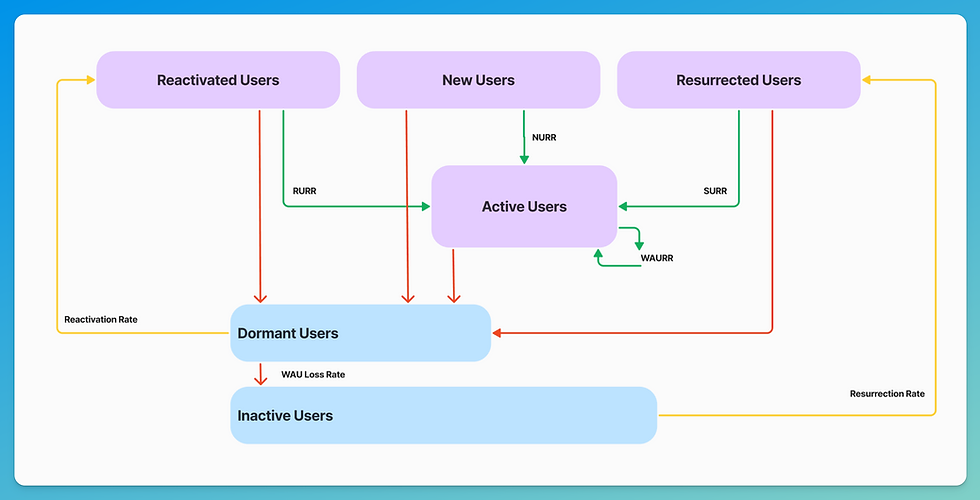
At the core of the model is a clear, state-based framework that classifies users into distinct categories based on their publishing activity that week.
These include:
New Users: Users who published for the first time and joined Buffer in the last 28 days
Current Users: Users who published this week and were also active last week
Reactivated Users: Previously dormant users who returned to publish again
Resurrected Users: Users who churned more than 28 days ago but became active again
Dormant Users: Users who were active last week but didn’t publish this week
Inactive Users: Users who haven’t published in at least 28 days
This structure allowed us to evolve beyond a binary view of active vs. inactive. We can now see how many users move between states week to week, how durable different types of users are, and where the biggest drop-offs (or comeback opportunities) exist.
Similar to Duo, we then layered on a set of retention and transition metrics to quantify these flows at our natural usage frequency.
WAU Retention Rate (WAURR): % of users who remain active week over week
New User Retention Rate (NURR): % of first-time users who stay active the following week
Reactivation and Resurrection Rates (RURR, SURR): % of dormant or inactive users who return
WAU Loss Rate: The % of WAU lost from dormant users transitioning to inactive states
Reactivation Rate: The % of dormant users who become active
Resurrection Rate: The % of inactive users who become active
Dormancy Rate: The % of WAU who have no activity in the subsequent period
These metrics give us a more granular understanding of where and how we lose users, and, more importantly, where we can win them back. It also helps us identify which lifecycle stages are most responsive to experiments, messaging, or product nudges from our growth efforts.
Our team actually reports on weekly state transitions and various retention measures as part of our ongoing growth reviews, and learns more about our users’ behavioural patterns from these than our composite possibly could.
Redefinition as a starting point
Shifting from our composite MAU to a behaviour-based WAU wasn’t just a metrics update. It was a reorientation for our teams and business that deepened our understanding of our unique users.
By anchoring our North Star in publishing, segmenting usage patterns, and building a week-over-week state model, we’ve unlocked new ways to support different types of users and build toward long-term retention for all of them.
This two-part series covered our journey from the broken promise of MAU to a behaviour-driven North Star. Redefining the metric was just the first step, and it’s already reshaping how we think about activation, retention, and long-term growth. My hope is that sharing this journey helps other teams pause, question, and evolve the way they define “active.”

Comments